
You spend weeks (maybe months) crafting a well-researched, beautifully written piece of content. You do the keyword research, build the links, write the meta descriptions. And then… crickets. Traffic barely moves. Rankings stay stubbornly low.
Meanwhile, a competitor with thinner content somehow sits above you on the search results page.
Here’s what might actually be going on: their site feels faster and smoother to use than yours — and Google’s been paying close attention to that since 2020. The name for what Google measures? Core Web Vitals.
By 2026, these metrics have gone from a “nice to have” to a non-negotiable part of any serious SEO and web performance strategy. This post breaks down what they are, why they matter more than ever, and — most importantly — how to actually fix them without needing a computer science degree.
So, What Exactly Are Core Web Vitals?
Core Web Vitals are a set of real-world performance metrics that Google uses to measure how users actually experience your website — not how it looks in a vacuum, but how it loads, responds, and behaves when a real person on a real device in a real location tries to use it.
There are three of them, and each one measures something different:
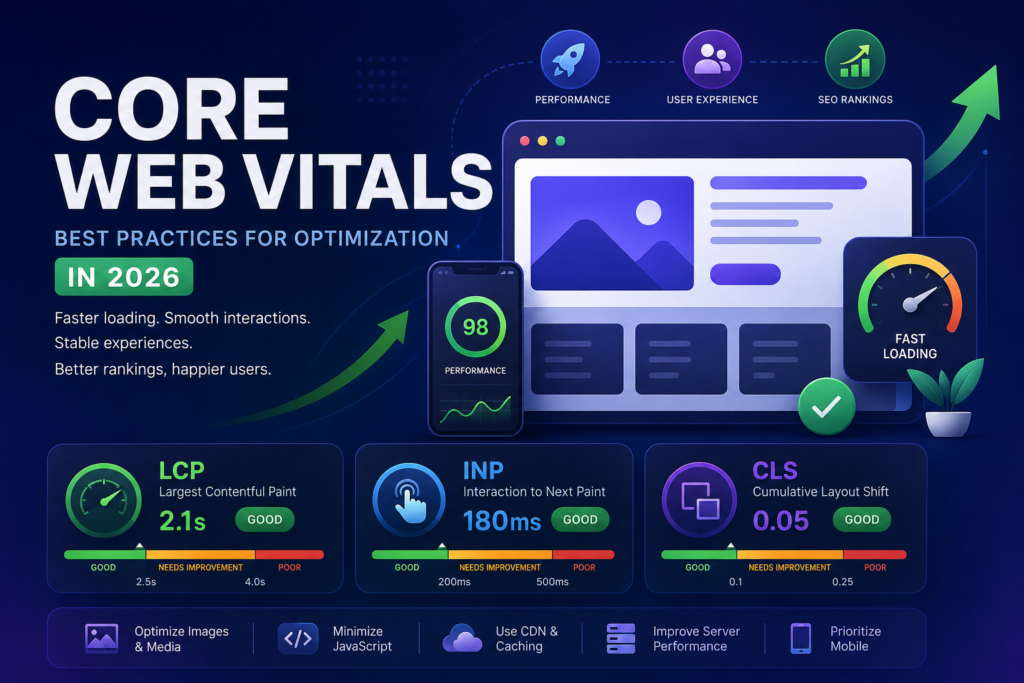
- LCP (Largest Contentful Paint) — How fast does the main content load?
- INP (Interaction to Next Paint) — How quickly does the page respond when someone clicks, taps, or types?
- CLS (Cumulative Layout Shift) — Does the page stay visually stable, or do things jump around unexpectedly?
Together, these three signals paint a picture of whether your site is genuinely pleasant to use — or quietly frustrating people into leaving.
The 2026 Thresholds: What “Good” Actually Means
Google divides each metric into three buckets: Good, Needs Improvement, and Poor. Here’s where the lines are drawn:
| Metric | Good | Needs Improvement | Poor |
|---|---|---|---|
| LCP | ≤ 2.5 seconds | 2.5s – 4.0s | > 4.0 seconds |
| INP | ≤ 200ms | 200ms – 500ms | > 500ms |
| CLS | ≤ 0.1 | 0.1 – 0.25 | > 0.25 |
To “pass” Core Web Vitals, your site needs to hit the Good threshold at the 75th percentile of real user visits. That last part matters. It’s not about your best-case performance — it’s about what most of your users actually experience.
A Quick Look at Where the Web Stands Today
Here’s the honest state of things in 2026:
- INP is the hardest to pass. Around 43% of websites still fail the 200ms threshold, making it the metric most sites struggle with. The reason? Fixing INP often requires rethinking how JavaScript is structured — you can’t just compress an image and call it done.
- LCP is the second toughest. Only about 62% of mobile pages achieve a good LCP score, largely because images and server response times are tricky to optimize well.
- CLS has the highest pass rate. Adding explicit dimensions to images and videos is more straightforward, so more sites have gotten this one right.
If you’re failing any of these, you’re not alone — but you’re also leaving real performance (and rankings) on the table.
Let’s Break Down Each Metric
1. LCP — Largest Contentful Paint
What it measures: The time from when a user first requests your page to when the largest visible element (typically a hero image, heading, or video thumbnail) appears on screen.
Think of it like this: LCP answers the question “When does this page actually feel loaded?” Not technically loaded (that’s a different thing), but loaded in the way a human notices. When the big visual element appears, people assume the page is ready — even if background processes are still running.
Common culprits for slow LCP:
- Large, unoptimized hero images
- Slow server response times (high TTFB)
- Render-blocking JavaScript and CSS that delays everything
- Fonts that take too long to load
How to fix it:
The single highest-impact fix for most sites is surprisingly simple: add fetchpriority="high" to your LCP image. This tells the browser “load this first, before almost anything else.”

Beyond that:
- Convert images to WebP or AVIF format — these are dramatically smaller than JPEGs and PNGs with similar visual quality
- Preload critical fonts and images using
<link rel="preload"> - Move to a faster hosting setup or CDN if your TTFB is sluggish
- Inline critical CSS directly in the
<head>so the browser doesn’t have to wait for an external stylesheet
One real-world data point worth knowing: Vodafone Italy ran an A/B test on two nearly identical pages. The only difference was a 31% improvement in LCP — and that single change drove 8% more sales. Performance isn’t just a technical metric; it’s a revenue variable.
2. INP — Interaction to Next Paint
What it measures: How long it takes your page to visually respond after a user interacts with it — a click, a tap, a keystroke. INP replaced the older FID (First Input Delay) metric in March 2024, and the upgrade matters.
Where FID only measured the first interaction on a page, INP tracks every interaction throughout the entire session and reports back on your worst-performing one at the 75th percentile. It’s far harder to game and far more representative of what users actually feel when they’re navigating your site.
Why INP is hard to fix:
A poor INP score almost always points back to JavaScript. When someone clicks a button, the browser has to stop whatever JavaScript is running, process the click, and update the visual display. If your JS is doing too much heavy lifting, that chain takes too long — and the user sees a frustrating delay.
Unlike image optimization, fixing this isn’t usually a one-line change. It often requires rethinking how and when your code runs.
Practical fixes:
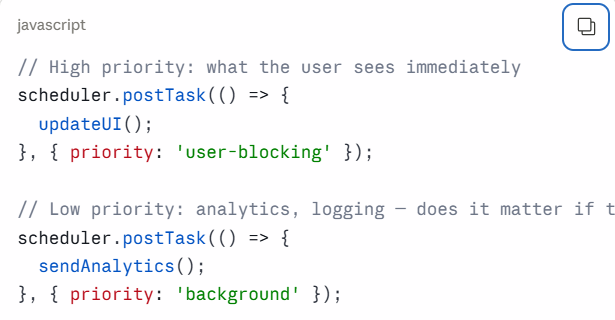
Break up long JavaScript tasks. Any task taking more than 50ms blocks the main thread and directly hurts INP. The modern way to handle this is with the Scheduler API:
Other smart moves:
- Defer non-essential third-party scripts (ad trackers, chat widgets, analytics)
- Use
requestAnimationFramefor any visual updates triggered by user interactions - Audit your event listeners — sometimes dozens of overlapping listeners are fighting each other
- Consider moving heavy computations into Web Workers so they run off the main thread entirely
3. CLS — Cumulative Layout Shift
What it measures: Visual stability. CLS captures how much the page layout shifts unexpectedly while it’s loading. If you’ve ever gone to click a button and then watched an ad load above it, pushing the button down by 200 pixels right as you tap — that’s a CLS problem, and it’s infuriating.
CLS scores are calculated by multiplying the size of a layout shift by the distance elements move. Lots of small shifts add up, and they all count against your score.
What causes layout shift:
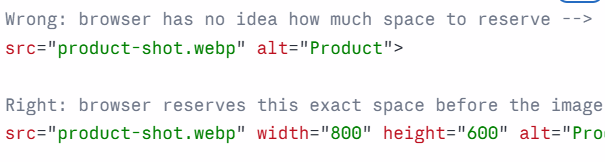
- Images and videos without explicit width/height dimensions
- Ads, embeds, and iframes that don’t have reserved space
- Fonts that swap in and change text sizing during load (FOUT/FOIT)
- Dynamically injected content (popups, banners, cookie notices) that pushes content down
How to fix it:
The most effective single change is also one of the easiest: always set explicit dimensions on images and videos.
For fonts, use font-display: swap in your CSS to allow text to render with a fallback font first, preventing invisible text that suddenly “pops in” and pushes everything around.
For ads and third-party embeds, always define a minimum height container so the page reserves space even before the embed loads.
Something New in 2026: Visual Stability Index (VSI)
Here’s something that’s been getting attention recently. In early 2026, Google quietly introduced what’s being called Core Web Vitals 2.0, adding a new signal: the Visual Stability Index (VSI).
Traditional CLS only measures layout shifts during initial page load. VSI goes further — it tracks visual instability that happens after the page is loaded, including shifts triggered by scroll, JavaScript interactions, and content lazy-loading mid-session.
This is still emerging, and the exact weighting in rankings isn’t fully clear yet. But if you’re building sites meant to last, it’s worth understanding early: the direction Google is heading is toward measuring the entire user session, not just the first few seconds.
Tools You Actually Need
You don’t have to guess about your scores. Here are the tools worth bookmarking:
Google PageSpeed Insights — The most widely used starting point. Combines real-user data from the Chrome User Experience Report (CrUX) with Lighthouse lab testing. Go here first.
Google Search Console — Under “Experience > Core Web Vitals,” you’ll find URL-level data and a breakdown of which pages are passing or failing. This is your best source of truth for SEO impact.
Chrome DevTools — Open the Performance panel and record an interaction. You can see exactly which JavaScript tasks are blocking responsiveness, down to the millisecond.
Lighthouse CLI / Lighthouse CI — Run automated performance tests in your build pipeline so regressions get caught before they hit production.
web-vitals JavaScript library — Drop this into your site to collect real-user Core Web Vitals data and send it to your own analytics. Gives you field data without depending entirely on Google’s tools.
One important note: PageSpeed Insights alone isn’t enough. Lab data and field data sometimes tell very different stories, especially on sites with diverse global audiences. Use both.
Platform-Specific Notes
WordPress: Use a caching plugin (WP Rocket, LiteSpeed Cache) and an image optimization plugin (Imagify, ShortPixel). Keep your plugin count lean — every plugin is potential JavaScript weight. Consider a lightweight theme over heavy page builders if INP is a problem.
Next.js: The next/image component handles lazy loading, sizing, and modern formats automatically — use it. The next/script component’s strategy="lazyOnload" option defers non-critical scripts cleanly.
Shopify: Shopify’s own hosting handles many server-side performance issues well, but themes — especially heavily customized ones — often pile on JavaScript. Audit your theme’s JS carefully, and be selective about which apps you install, as each one typically injects its own scripts.
A Practical Prioritization Framework
Don’t try to fix everything at once. Here’s a sensible order of operations:
Step 1: Measure. Run PageSpeed Insights on your five most important pages. Note which metrics are failing and by how much.
Step 2: Start with LCP. It usually has the clearest fixes (image optimization, preloading, TTFB) and the highest direct impact on perceived load speed.
Step 3: Address CLS. Add dimensions to images and reserve space for dynamic content. These changes are low-risk and often quick to deploy.
Step 4: Tackle INP. This one takes more investigation. Use Chrome DevTools to profile slow interactions and find the specific JavaScript tasks causing problems. This step often surfaces deeper architectural issues worth fixing regardless of Core Web Vitals.
Step 5: Monitor. Set up Lighthouse CI in your build pipeline and check Search Console monthly. Core Web Vitals can degrade silently after updates, plugin changes, or new content — regular monitoring is the only way to catch regressions early.
It’s easy to get so focused on scores that you lose sight of why these metrics exist. Core Web Vitals aren’t bureaucratic hurdles Google invented to make developers’ lives harder. They’re measurements of a genuinely important question: Does using this website feel good?
A page that loads fast, responds instantly, and doesn’t jump around when you’re trying to read it is a page people trust. They stay longer, click more, come back again. The SEO benefits are real, but they’re almost secondary to the more fundamental improvement: you’re building something people actually enjoy using.
In 2026, the gap between sites that take performance seriously and those that don’t is wider than ever. The good news is that the tools, knowledge, and frameworks to close that gap are more accessible than ever too.
Start with what’s failing most. Make one fix. Measure again. The compounding effect of small, consistent improvements is what eventually gets you across every threshold — and keeps you there.